When we talk about water quality, the focus is often on rivers, lakes, and oceans. But in many parts of the U.S.-and especially in Nebraska-a major source of freshwater lies underground. This groundwater supports agriculture and provides drinking water for most of the population in Nebraska. Taro Mieno, a faculty member in the Agricultural Economics Department at University of Nebraska-Lincoln (UNL) and Daugherty Water for Food Global Institute Faculty Fellow; Shunkei Kakimoto, a graduate student in Applied Economics at the University of Minnesota (and former UNL student); and I have been collaborating on a project to better understand the effectiveness of Nebraska's groundwater protection efforts.
Background
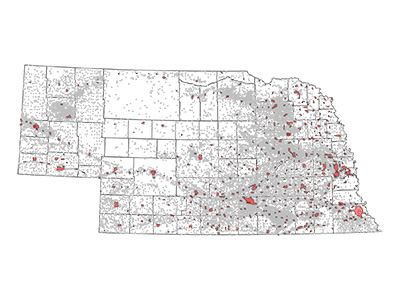
Data: Nebraska Department of Water, Energy, and Environment and the Nebraska Groundwater Quality Clearinghouse. Figure created by authors.
Groundwater is vulnerable to contamination from surface-level activities, particularly in agricultural areas. To address this, many states have adopted Wellhead Protection Areas (WPAs)-designated zones around public drinking water wells where land use is managed to prevent contaminants from reaching the aquifer near the wellhead. The current WPAs are shown in Figure 1. Establishing WPAs is a voluntary decision made by local communities. However, under the Safe Drinking Water Act (SDWA), the U.S. Environmental Protection Agency (EPA) requires states to support this process by providing technical assistance, such as helping to map WPA boundaries. In Nebraska, the Department of Water, Energy, and Environment (DWEE) assists communities in delineating these areas.
What is this study about?
Although WPAs are supported by federal guidance under the SDWA and are part of the EPA's recommended multi-barrier approach to drinking water safety, there has been limited practical research on whether WPAs improve groundwater quality. In our study, we evaluate the effectiveness of WPAs in reducing nitrate contamination in Nebraska's groundwater. We use data from the Nebraska Groundwater Quality Clearinghouse covering the years 1996 to 2019, including over two million nitrate records from about 33,000 wells across the state.
WPAs in Nebraska weren't implemented all at once. Instead, they were introduced gradually between 1994 and 2016 (see Figure 2). This slow, step-by-step rollout made it a difficult to study the impact of the policy. To handle this, we used a research method that helps compare places that adopted WPAs with those that had not-while also taking into account that each place joined the program at a different time. This approach builds on a commonly used technique called "difference-in-differences," which helps researchers figure out if a policy made a difference by comparing changes over time between areas that adopted the policy and those that did not.
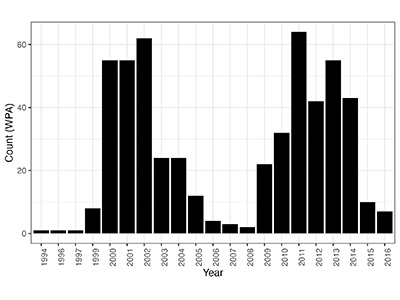
Data: Nebraska Department of Water, Energy, and Environment
The traditional version of this method assumes that everyone starts the policy at the same time. Since that wasn't the case here, we used a newer version of the method-the Extended Two-Way Fixed Effects (ETWFE) model-that can better handle this kind of staggered rollout. It lets us more accurately measure the policy's impact over time and across different locations.
What did we find?
Our results suggest two key points. First, WPAs are associated with reductions in groundwater nitrate concentrations over time. On average, nitrate levels fell by 0.71 mg/L per year after WPA designation. This is a meaningful reduction given the EPA's maximum contaminant level of 10 mg/L for public drinking water.
Second, the benefits take time to appear. The full effect of WPAs doesn't materialize immediately-it takes roughly 15 years for the policy's impact to fully register in groundwater measurements. This lag is consistent with research on nitrate transport, which shows that contaminants can take years to move from surface sources into groundwater (Gates et al. 2014; Lassaletta et al. 2014).
Why do our findings matter in real-life?
This time lag has important implications. Policies aimed at reducing non-point source pollution-like groundwater nitrate-may be working even if early measurements don't show much change. Several studies (Meals et al. 2010; Basu et al. 2022) have emphasized the risk of prematurely labeling policies as ineffective simply because the environmental response is delayed.
Our study adds to the growing body of evidence that proactive land-use policies can improve water quality. It also underscores the importance of maintaining long-term environmental monitoring systems. Without long data series and spatially detailed information, it would be difficult to detect gradual changes like the ones we observe with WPAs. We were able to conduct this analysis thanks to Nebraska's ongoing commitment to protecting groundwater for both drinking and agriculture. The Nebraska Groundwater Quality Clearinghouse data was invaluable to this work and stands as a success story-an example that other states and jurisdictions can learn from when building data systems to support environmental policy evaluation.
Works cited
Basu, Nandita B, Kimberly J Van Meter, Danyka K Byrnes, Philippe Van Cappellen, Roy Brouwer, Brian H Jacobsen, Jerker Jarsjö, et al. 2022. "Managing Nitrogen Legacies to Accelerate Water Quality Improvement." Nature Geoscience 15 (2): 97-105.
Gates, John B, Gregory V Steele, Paolo Nasta, and Jozsef Szilagyi. 2014. "Lithologic Influences on Groundwater Recharge Through Incised Glacial till from Profile to Regional Scales: Evidence from Glaciated Eastern Nebraska." Water Resources Research 50 (1): 466-81.
Lassaletta, Luis, Gilles Billen, Bruna Grizzetti, Juliette Anglade, and Josette Garnier. 2014. "50 Year Trends in Nitrogen Use Efficiency of World Cropping Systems: The Relationship Between Yield and Nitrogen Input to Cropland." Environmental Research Letters 9 (10): 105011.
Meals, Donald W, Steven A Dressing, and Thomas E Davenport. 2010. "Lag Time in Water Quality Response to Best Management Practices: A Review." Journal of Environmental Quality 39 (1): 85-96.
Acknowledgement
This work in part was supported by the U.S. Department of Agriculture (USDA), Office of the Chief Economist (OCE).
Disclaimer
The findings and conclusions in this blog are those of the author(s) and should not be construed to represent any official USDA or U.S. Government determination or policy.