A steer grazes on fall oats (cover crops). Credit: IANR UNL
The world is facing a balancing act: working to feed more than 9 billion people by 2050 while being good stewards of our limited natural resources. To achieve this balance, we must understand how our water is allocated and how well we are using it. The Daugherty Water for Food Global Institute (DWFI) at the University of Nebraska aims create a series of “living” reports that provide water productivity insights for important food-producing regions of the world. To begin, we looked at data in our own backyard.
Nebraska is a national leader in agricultural production: it is the third largest producer of maize and second largest in cattle production. Agricultural production contributed about $23 billion to Nebraska’s economy in 2016 (USDA-ERS, 2017). Irrigation plays a vital role in Nebraska’s agricultural dominance. In 2017, 65 percent of maize and 55 percent of soybeans were produced using irrigation (USDA-NASS, 2014). The state ranks first in the nation in terms of total irrigated cropped area with 3.4 million hectares (USDA-NASS, 2014). The expansion of irrigated agriculture has intensified competition for limited water resources.
Recent droughts combined with observed groundwater drawdown has increased pressure on the state’s agricultural sector to reduce its water use and improve its water productivity. As the major water user, increasing the water productivity of crop and livestock production will play an important role in improving the state’s sustainable water use. Over the last 40 years, more and more farms have replaced gravity fed surface irrigation systems with more efficient pressurized irrigation systems. In 1984, gravity systems were used in 67 percent of the irrigated area in the state. This contribution dropped to only 15 percent by 2013, with pressurized irrigation systems now accounting for 85 percent of the irrigated area in the state.
DWFI is preparing the first edition of the Nebraska Water Productivity Report, which will be released later this year. The report assesses the water productivity (WP) of crop and livestock production, and the water, energy and carbon footprint of ethanol production in the state. Results from the report show improvements in the irrigation application and water productivity of crop and livestock products, over the last decade as briefly highlighted below.
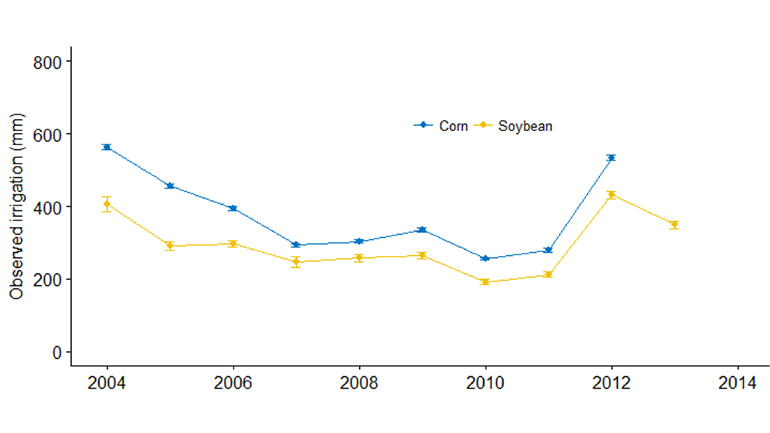
The observed shift to more efficient irrigation systems has helped to reduce the field level irrigation application depth in the state. For example, observed applied irrigation has dropped (Figure 1) on average by 110 mm (or by 20 percent) from 2004 to 2013 for corn and 39 mm (or by 8 percent) for soybean in three of Nebraska’s Natural Resources Districts (NRDs), including the Central Plate, Lower Niobrara and Tri-Basin. Such improvement is encouraging, but there is room for further reduction in irrigation application depths in those fields and areas where it is currently high.

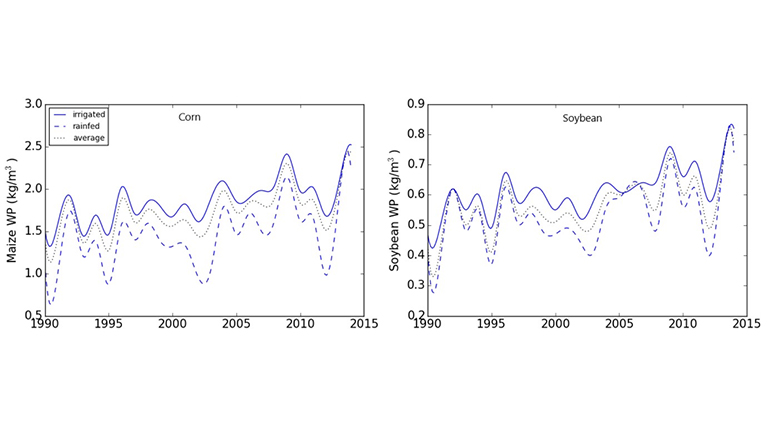
The WP of irrigated and dryland corn and soybean has improved significantly across the state (Figure 2). Between 1990 and 2014, the WP of irrigated and dryland (rainfed) corn has increased by 65 and 98 percent, respectively. Similarly, the WP of soybean also showed large growth during the same period: 72 percent for the irrigated and 79 percent for dryland WP. Improved varieties with high yield and good tolerance to water stress, fertilizer and soil management, and weed control have helped to increase crop yield.

Nebraska is the second largest producer of cattle, following Texas, accounting for 7.1 percent of the U.S. total cattle inventory and 12.4 percent of beef production (USDA, 2017). In 2016, the total value of its livestock sector, including poultry, was $12.2 billion — equivalent to 54 percent of the total economic value of the state’s agricultural sector (USDA-ERS, 2017). Given its importance to the state’s economy and its impacts on water resources, studying the WP of the different livestock products is highly relevant.
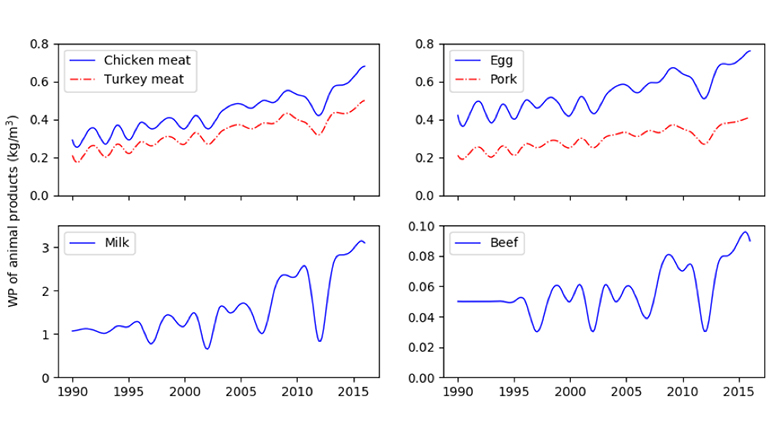
Similar to the trend in the WP of crops, the WP of all livestock products has increased considerably from 1990 to 2016 (Figure 3). The biggest increase was for dairy milk, which almost tripled, followed by chicken and poultry meats, which increased 2.4 times between 1990 and 2016. The increase in the WP is a combination of improvement in the livestock productivity (output per head) that has resulted in the decrease in the feed requirement per unit of animal products produced (meat, milk, egg) and improvement in the yield of the feed crops and fodders that resulted in a big decline in the water required to grow the feeds.

Increasing trends in the WP of livestock products is also encouraging. But the question is, will these trends continue and to what extent? Setting benchmarks, estimating WP gaps, and identifying the critical factors are potential future areas of research to keep the current trend and reach even higher WP levels.
References
USDA-ERS (2017) Value added to the U.S. economy by the agricultural sector, 2010-2017F. Economic Research Service, United States Department of Agriculture (USDA ERS), Washington, D.C.
USDA-ERS, (2018) US Bioenergy Statistics. US Department of Agriculture, Economic Research Service, Washington DC.
USDA-NASS, (2014) 2012 Census of Agriculture: Farm and Ranch Irrigation Survey (2013) U.S. Department of Agriculture-National Agricultural Statistics Service (USDA-NASS), Washington, DC.
USDA, (2017) Agricultural Statistics Data Base (Quick Stats). U.S. Department of Agriculture, National Agricultural Statistics Service (USDA-NASS), Washington, D.C.

